bar chart
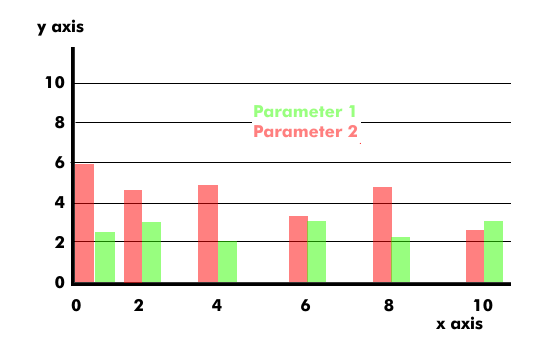
Bar charts represent values in the form of horizontal bars; in histograms and bar charts, the bars are aligned vertically. Both charts are used in presentation graphics and clearly show the differences and ranking of statistical surveys or economic business data.
In bar charts, the data is usually classified beforehand. The bars themselves can represent a single value - sales, number of employees, page views - or consist of multiple values. For example, the bar for employees may consist of subgroups of temporary workers, trainees, etc.
Bars of bar charts can be varied in bar width, they can be drawn in different colors or with hatching, and they can take positive and also negative values.