pivot table
A pivot table is a table that can grow on two sides. It is used in spreadsheet tools such as MS Excel or OpenOffice, but also in analysis applications, e.g. OLAP tools, Online Analytical Processing (OLAP).
A table contains columns and rows. This makes it two-dimensional, but the columns are usually fixed. Each column contains a certain type of data, e.g. name, employee number, address, phone, etc. Thus such a table grows only vertically. If e.g. a new employee is added, then there is a new row.
In contrast, in a pivot table both the rows and the columns consist of variable sizes. For example, each row can contain one employee and each column can contain one quarter. This opens a two-dimensional area of nodes between employee and quarter. These nodes are now assigned key figures, e.g. the achieved turnover per employee and quarter.
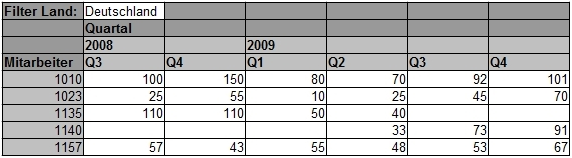
This representation makes relationships much easier to read than if one were to simply write one row below the other for each employee and quarter. Therefore, pivot tables are especially suitable for analyses.
All modern spreadsheet programs offer pivot table functionality. One of the most important applications of pivot tables is the analysis of data in OLAP cubes. The structure of dimensions and facts (key figures) is ideal for filling pivot tables. Especially the Slice and Dice technique is used here.